Survivorship curves: All 3 types, Characters and examples
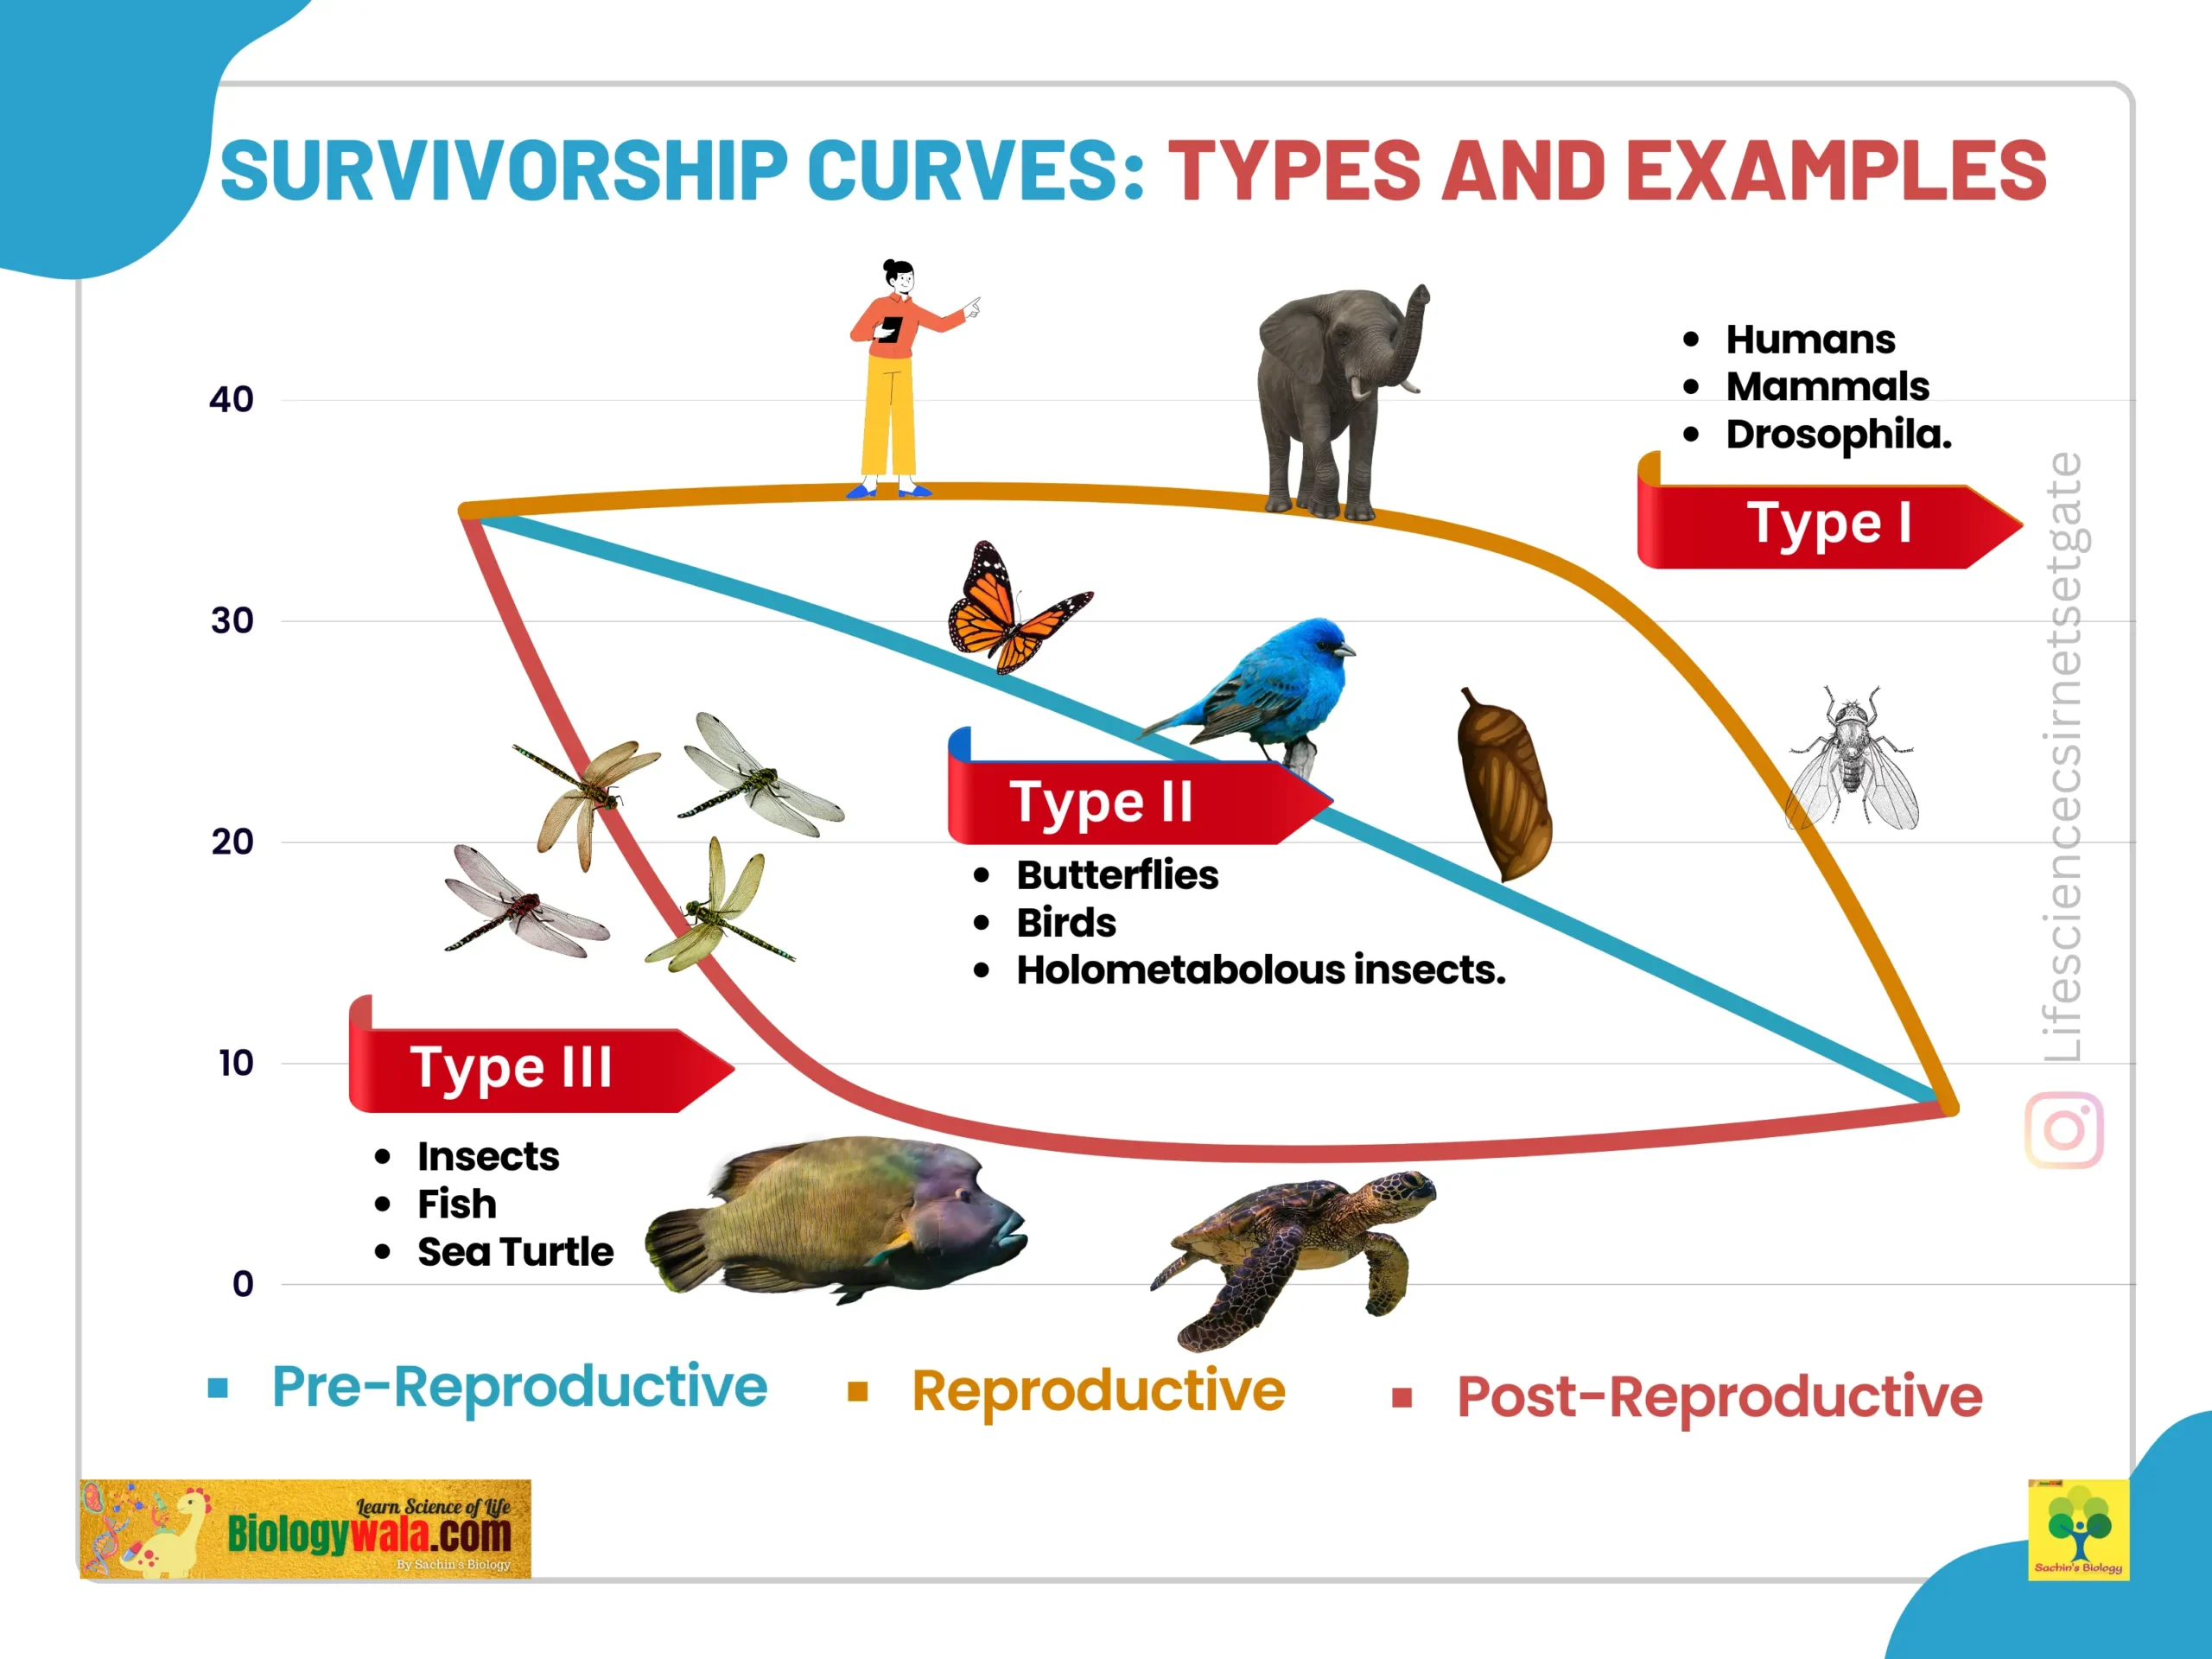
What is the survivorship curve?
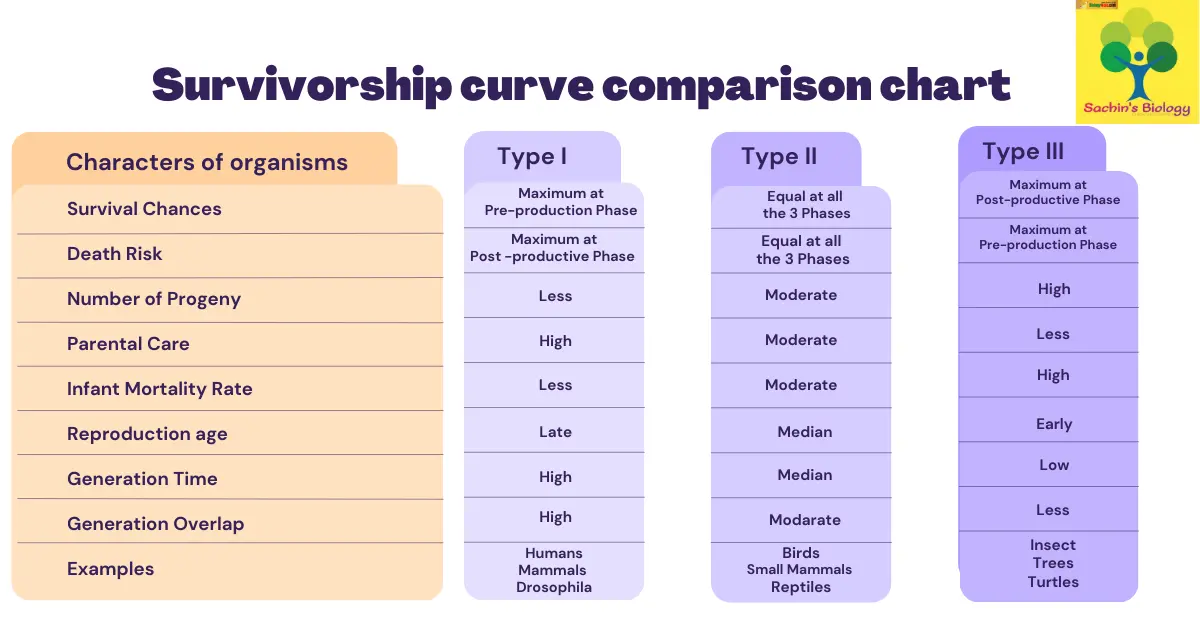
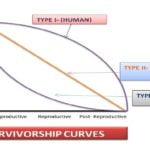
Survivorship curves are the graphic representation of Survival chances at different ages of individuals. based on numbers of survival in log scale at pre-reproductive, reproductive, and post-reproductive phases.

Survivorship curves Types
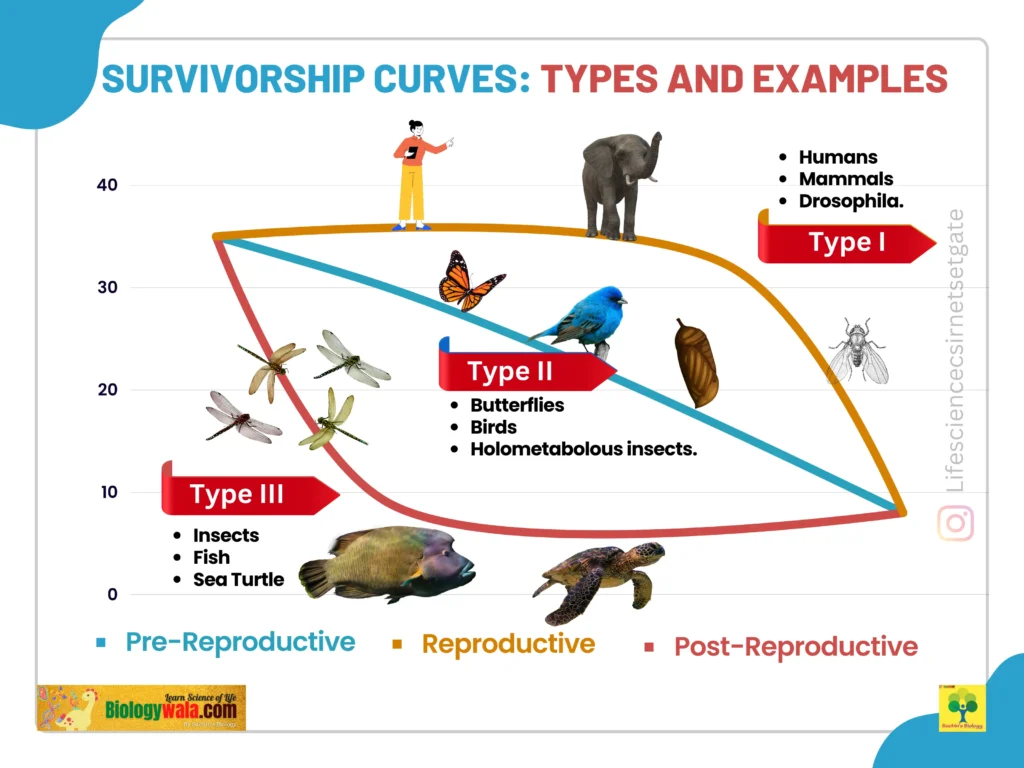
As shown in the above image there are three types of survivorship curves based on their survival strategies at different stages of life.
Type I Survivorship curve:
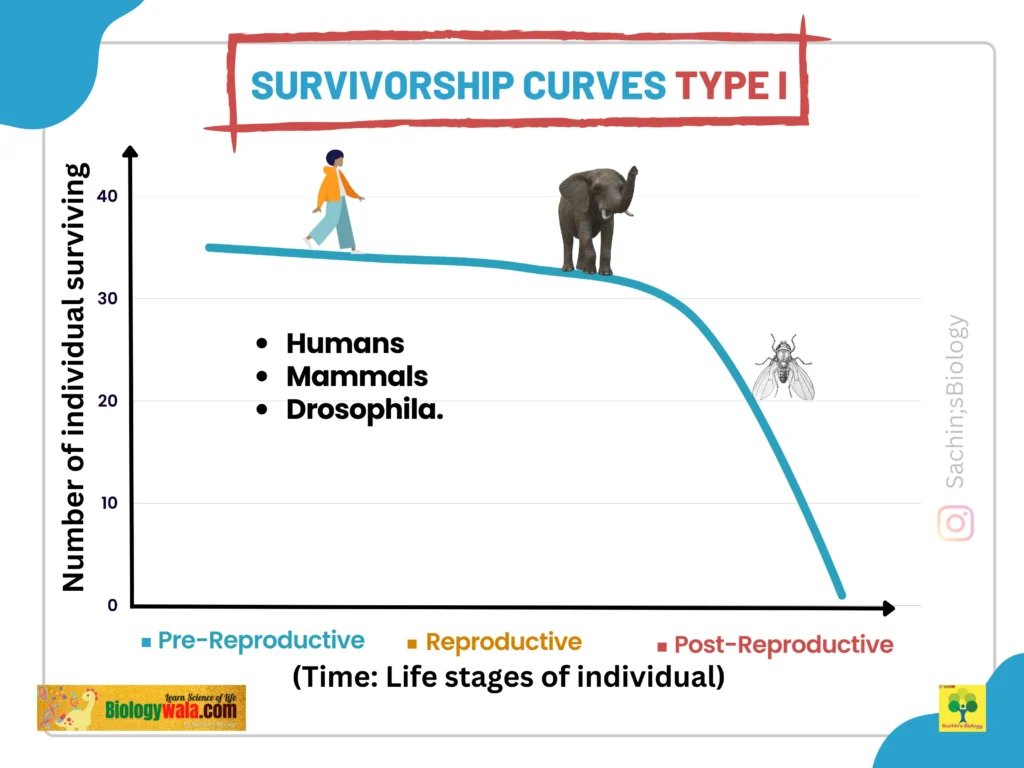
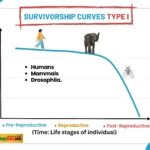
Type i survivorship curve is shown by typically ‘K’ selected species. In the type, I curve the mortality rate at juvenile (newborn) is comparatively low as maximum deaths occur at the post-reproductive phase. Because they become older and more susceptible to diseases and predation. Organisms showing type 1 survivorship curves tend to produce less number progeny and invest high energy in parental care. High parental care and fewer progeny results in a low infant (at early stages) mortality rate.
It is an excellent strategy to produce fewer numbers of progeny with high parental care to increase the survival rate of offspring under predation force. This survival strategy increases the likelihood of being alive. High generation time and late reproduction are the distinct characteristics of individuals with type i survivorship curves. Such individuals generally show a shallow slope at a young age and an abrupt increase in death at later stages of life. Hence finally it became the CONVEX curve.
Characteristics of survivorship curve i:
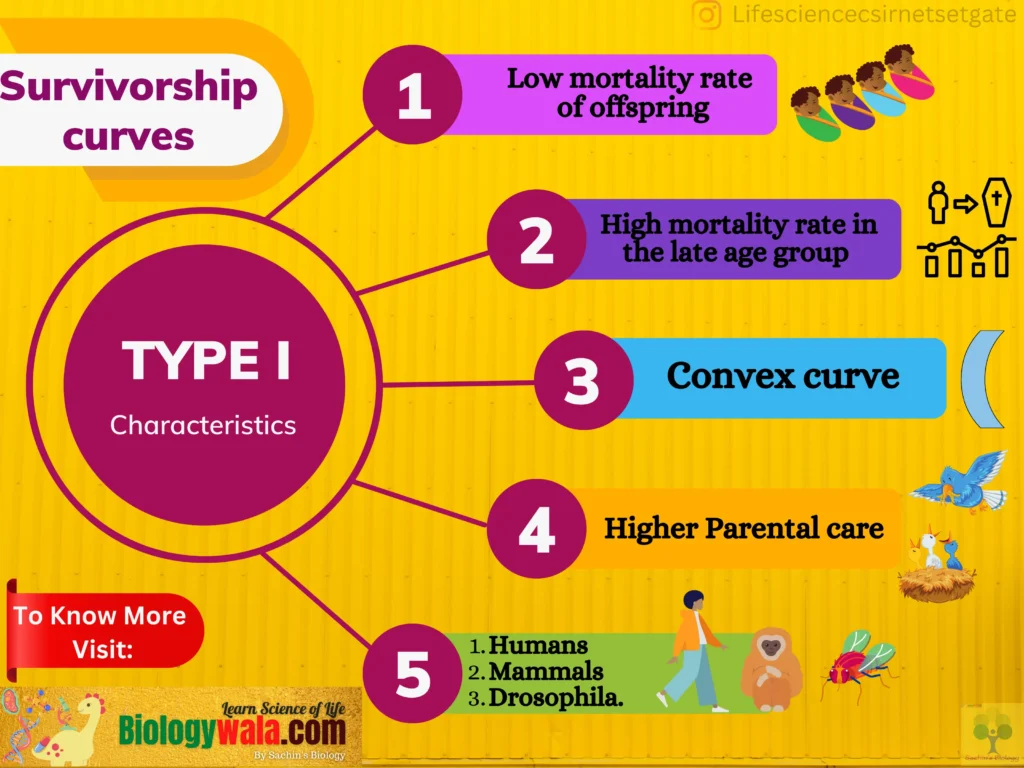
- The low mortality rate of offspring (early age group)
- The high mortality rate in the late age group
- Higher Parental care, low clutch size
- Convex curve
Examples of survivorship curve I:
- Humans
- Mammals
- Drosophila.
Type II survivorship curve:
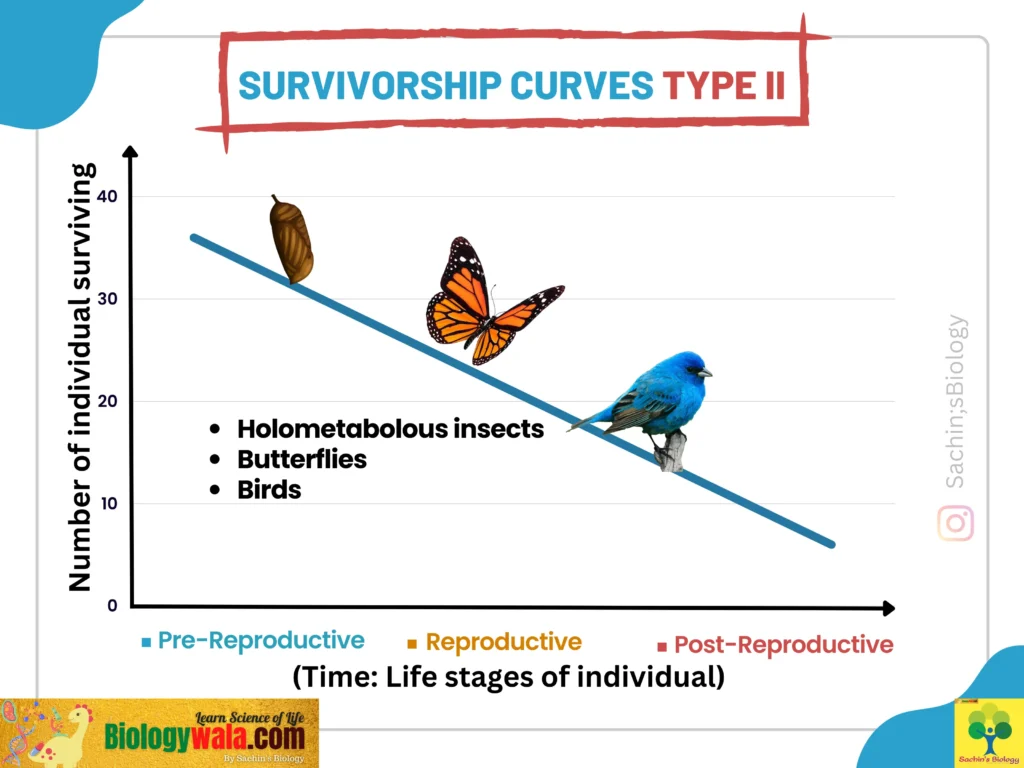
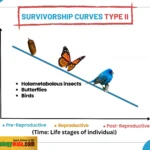
Organisms with type ii survivorship curves show moderate changes with nearly uniform death rates thought out their life. This type of curve is generally shown by organisms that live under continuous predator pressure. Individuals are lost mostly due to accidents and predation. The species with type ii survivorship curves include small mammals, many birds, and some annual plants as well. The individuals in this type of curve are not born as fit as type I nor as fragile as the type III survivorship curve.
If we plotted the graph with the number of individuals on the X-axis and age groups on Y axis the survivorship curve we get is a straight line. The main reason behind this is a moderate parental investment and a constant proportion of survival chances. this straight line graph is nearly the same life expectancy throughout the life history (at all 3 age intervals). The age-sex structure of organisms that survive in the type ii curve is more or less equal. Hence shows the same population survival chances throughout the life cycle.
The population pyramid of species showing the survivorship curve ii is stable bell-shaped with somewhat equal individuals of early ages, reproductive age and post-reproductive age.
The numbers of progeny produced are moderate and not as large as the type III survivorship curve showing individuals.
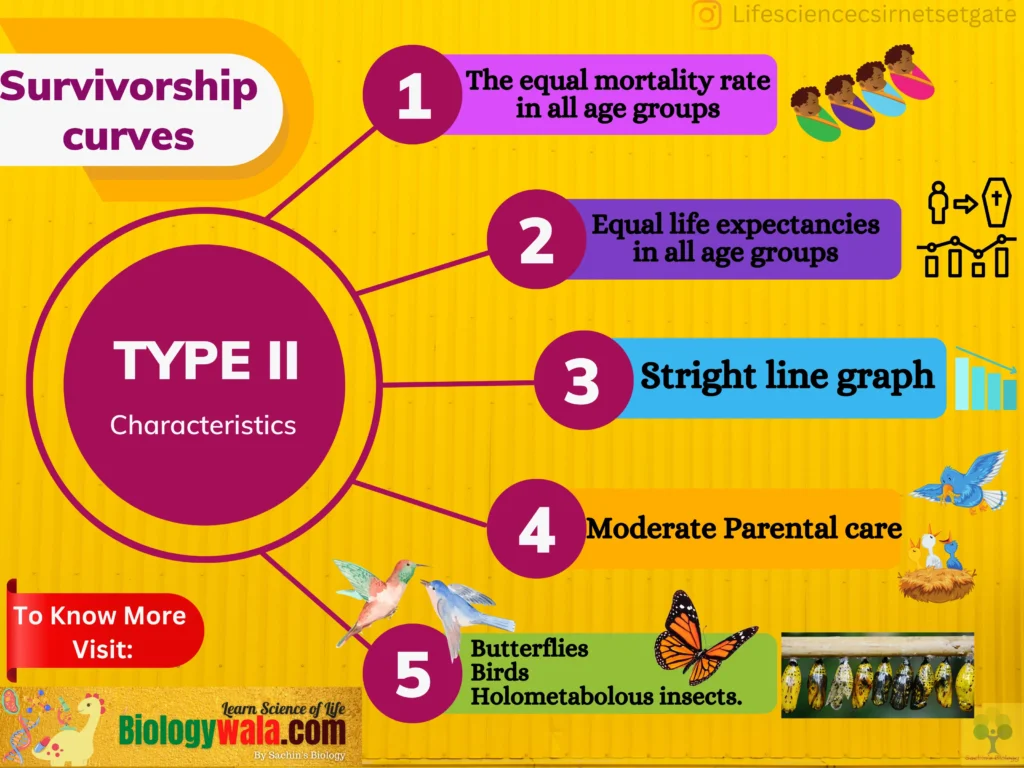
Characteristics of survivorship curve ii:
- The equal mortality rate in all age groups
- Equal life expectancies in age groups
- Moderate Parental care
- Straight line curve
Examples of type ii survivorship curve:
Examples of Type II survivorship curves are butterflies ( important for CSIR NET EXAM), birds, mice, rabbits, and most holometabolous insects (in case you don’t know: Holometabolism, also called complete metamorphosis, is a form of insect development which includes four life stages: egg, larva, pupa, and imago or adult.)
Type III Survivorship curve:
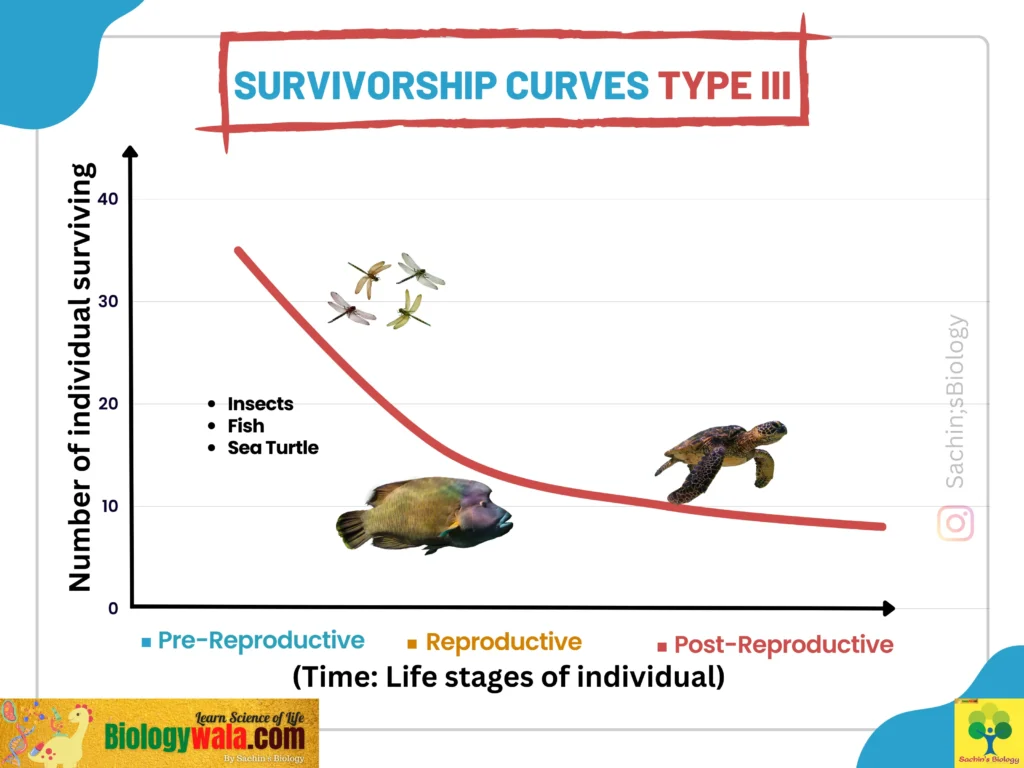
Organisms that invest high energy to produce millions of offspring show a type III survivorship curve. These organisms produce a large number of progeny and display a Higher fecundity (ability to produce an abundance of offspring ) with age if they survive up to reproductive age. In the survivorship curves, the rate of loss of juveniles is high, so individuals die young, which is shown by the early downfall of the survival curve.
Survival becomes easy for the individual which avoids early deaths, hence at the end curve becomes flattened. As shown in the graph if we plot several individuals on the X-axis and age groups on the Y-axis the overall type iii survivorship curve comes concave. As few offspring could survive because of harsh environmental conditions or higher predation rates. If an individual survives the younger years of his life history then there are high chances of survival.
The early and middle life history of the organisms following this survivorship curve shows, a high mortality rate (Death rate) as compared to type i and type ii survivorship curves. The main reason behind this is very low or no parental care. Low parental care is one of the characteristic features of the type iii curve. The individuals following the type iii curve show short life spans as of ‘r’ selected species ex. Insects.
What is ‘r’ selected species?
The species with high clutch size, fecundity rate, low fitness value, and no parental investment are known as ‘r’ selected species.
r selected species show this type of survivorship curve as they produce a huge amount of offspring. The population growth of r selected species tends to go downwards drastically so as does the death rate. Especially in the early life history of many offspring, the population dies and there is a rapid decline in the number of individuals surviving. If the offspring survives up to a certain age then there are more chances of survival, especially in old age.
Generally, this type of survival strategy is used in harsh environmental conditions where the survival chances of newborns are less. To overcome this less survival chance organisms produce a high number of offspring so that even after many deaths in the initial (juvenile) phase a sufficient number of offspring will survive.
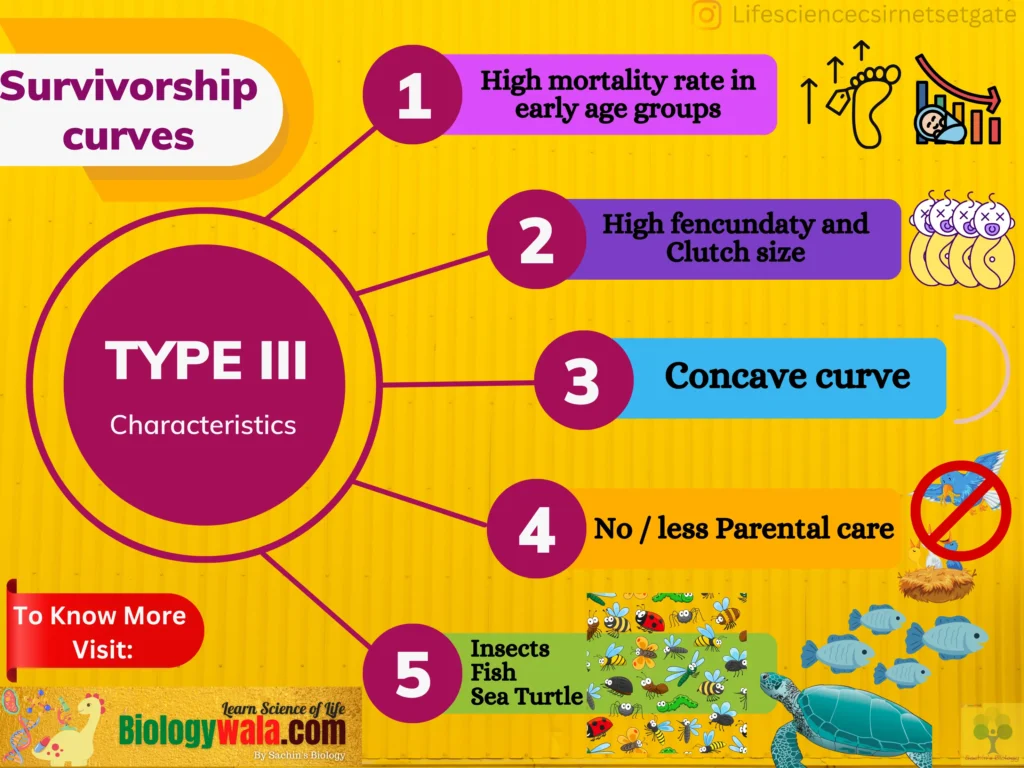
Characteristics of survivorship curve iii:
- The high mortality rate of offspring (early age group)
- The low mortality rate in the late age group
- Low or No Parental care, High clutch size
- Concave curve
Examples of survivorship curve iii:
Fish and Marine invertebrates use this pattern. Many insects and plants also fit the type III survivorship curve because they lay many eggs and released hundred of seeds respectively and most of these die. Given species like Sea turtles, oysters are typical examples of type iii survivorship curves.
What is the survivorship curve?
Survivorship curves are the graphic representation of Survival chances at different ages of individuals. based on numbers of survival in log scale at pre-reproductive, reproductive, and post-reproductive phages.
What are the examples of survivorship curve 1
1. Humans
2. Mammals
3. Drosophila.
What are the examples of survivorship curve 2?
Examples of Type II survivorship curves are butterflies ( important for CSIR NET EXAM), birds, mice, rabbits, and most holometabolous insects (in case you don’t know: Holometabolism, also called complete metamorphosis, is a form of insect development which includes four life stages: egg, larva, pupa, and imago or adult.)
What are the examples of survivorship curve 3?
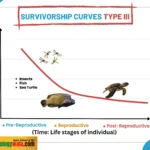
Fish and Marine invertebrates use this pattern. Many insects and plants also fit the type III survivorship curve because they lay many eggs and released hundred of seeds respectively and most of these die. Other examples include sea turtles, oysters, fish, and trees.
What are the differences between Survivorship curves 1, 2 and 3?
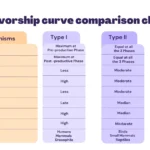
There are several differences between Survivorship curves 1, 2 and 3 all have mentioned in this table image!
If you are having a problem with the clarity of the image you can download the same survivorship curve table from here :
Download Survivorship Curve Table Notes
That’s it for the Survivorship Curve article, see you in the next article.
Also Like:
Ecological succession: Important Types and 3 Mechanisms
If you want daily notes and updates about exams on your mobile then you can join SACHIN’S BIOLOGY on Instagram or Facebook and can directly talk to the founder of Sachin’s Biology and Author of biologywala.com Mr Sachin Chavan M.Sc. NET JRF (AIR 21) GATE!


Easy to understand..
Great job Sachin..